Debugging
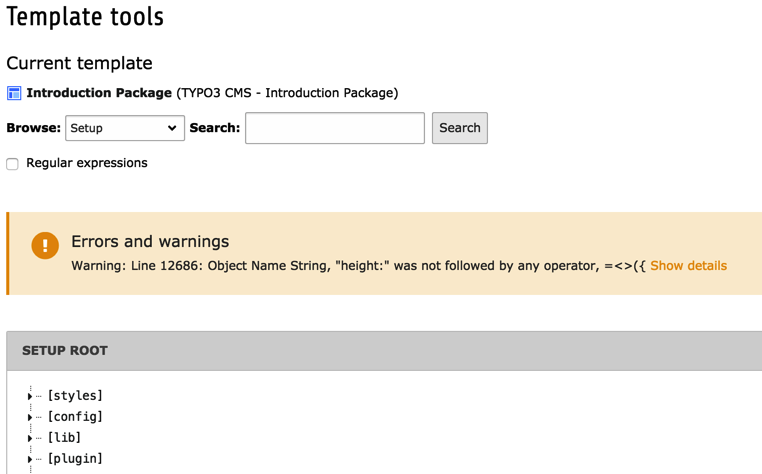
There are no tools that will tell you that your TypoScript code is 100% correct. The TypoScript Object Browser will warn you about syntax errors though:
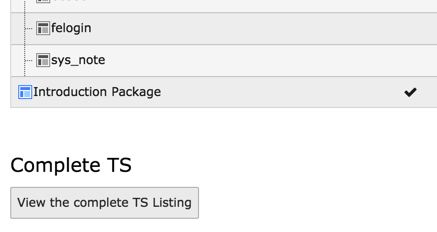
Errors will also appear in the Template Analyzer, when viewing the content of a give template. It is also possible to see the full TypoScript code by clicking on the "View the complete TS listing" button at the bottom of the Template Analyzer:
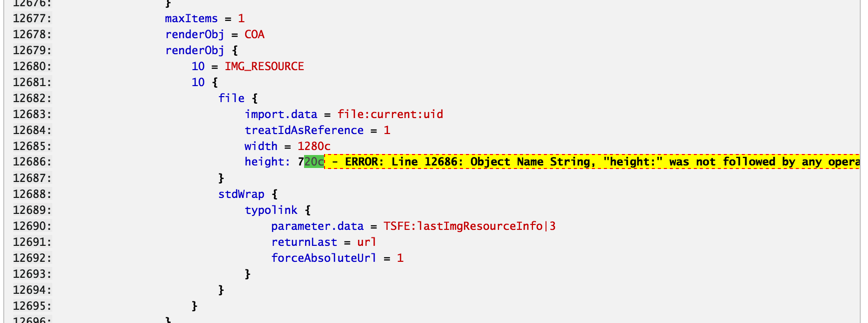
The result is a long listing with all compiled line numbers, which makes it easy to find the error reported by the TypoScript Object Browser.
In the frontend, the Admin Panel is another possibility to debug TypoScript; use its section called "TypoScript"! It shows you selected rendered (configuration) values, SQL queries, error messages and more.
TypoScript itself offers a number of debug functions:
- stdWrap comes with the properties debug, debugFunc and debugData which help checking which values are currently available and which configuration is being handled.
- GMENU, TMENU and IMGMENU come with the property debugItemConf. If set to "1", it outputs the configuration arrays for each menu item. Useful to debug optionSplit things and such.